Luka Negoita, PhD
Hi, I'm Luka and I'm a Data Scientist. My portfolio includes some of the projects I've worked on, with a strong emphasis on actionable insights, research, and biodiversity conservation. Click here to see my resume
I also run an online school where I teach R for Ecology :)
Data Science Portfolio
How many days in advance should you be booking your Airbnb?
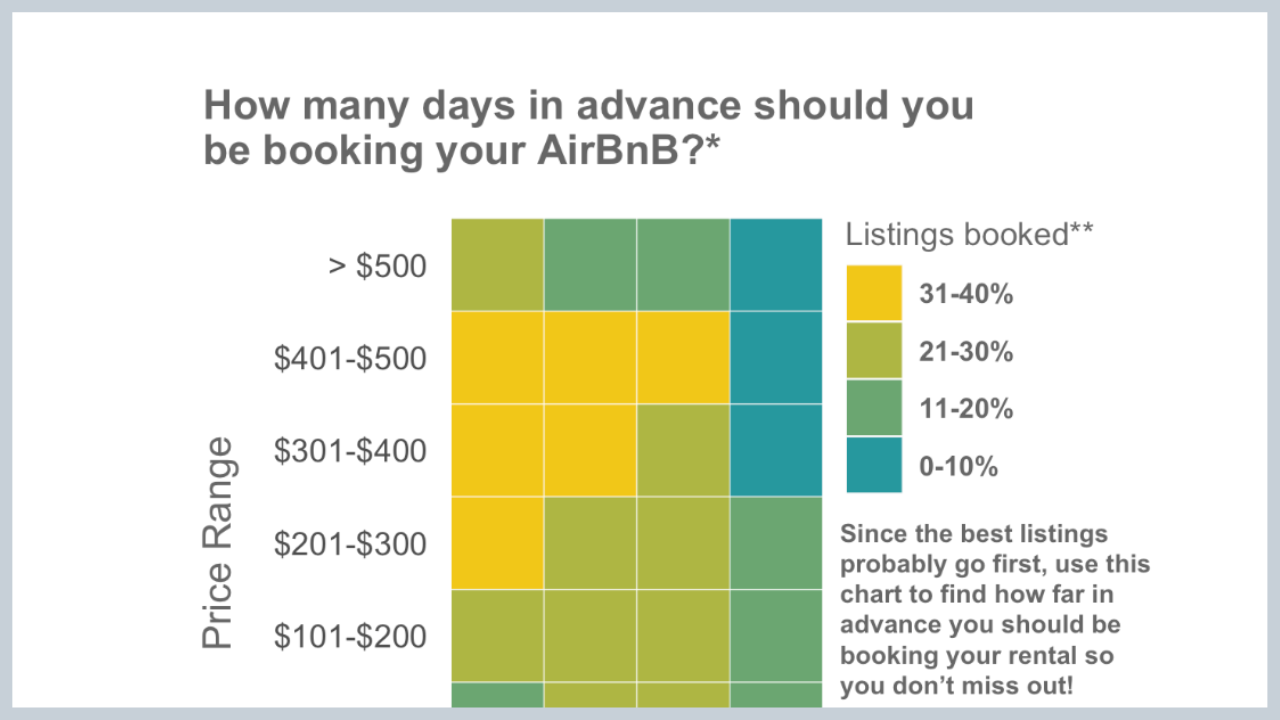
Here I explored available Airbnb data on pricing and availability. In the process I came up with a visualization for understanding how many days in advance you should be booking your Airbnb rental. Click here to view the project.
Exploring Continuous Glucose Monitoring data to predict ‘glucotypes’
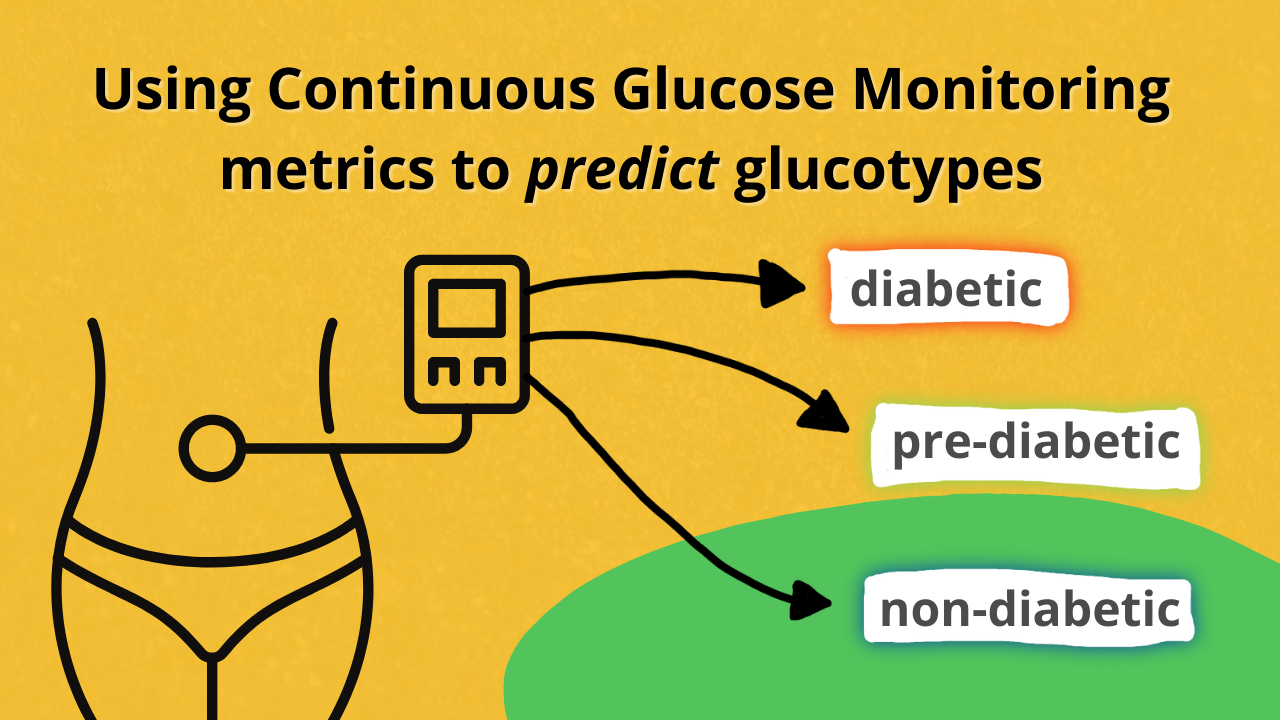
Here I explored the data of Hall et al. 2018 with the goal of learning more about CGM data. I applied Irina Gayanova’s CGM metrics to Hall et al’s dataset and found a way to predict the same glucotypes that Hall et al. established, but while using Gayanova’s CGM metrics. The best solution I found (with 87% accuracy) was using PCA to reduce all the metrics to just a few components that I then fit with a boosted decision tree model. Click here to view the project.
Predicting the arrival of COVID-19 to the Galapagos Islands
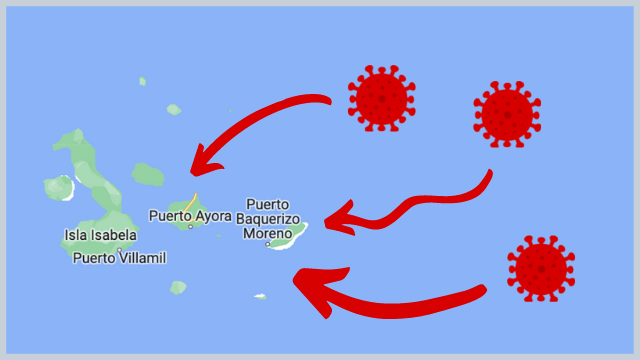
I was able to predict the arrival of COVID-19 to the local community of the Galapagos Islands, Ecuador. I used tourist visitation and current coronavirus data to estimate various scenarios on the probability that the virus would reach the islands. My results concluded that a complete stop of incoming tourist flights would be the only way to delay arrival and reduce the curve. A complete lock-down of tourist travel to the islands was implemented within weeks of sharing my results with local healthcare and government officials—a decision that likely saved lives.
Exploring temporal data with airbnb seasonal availability
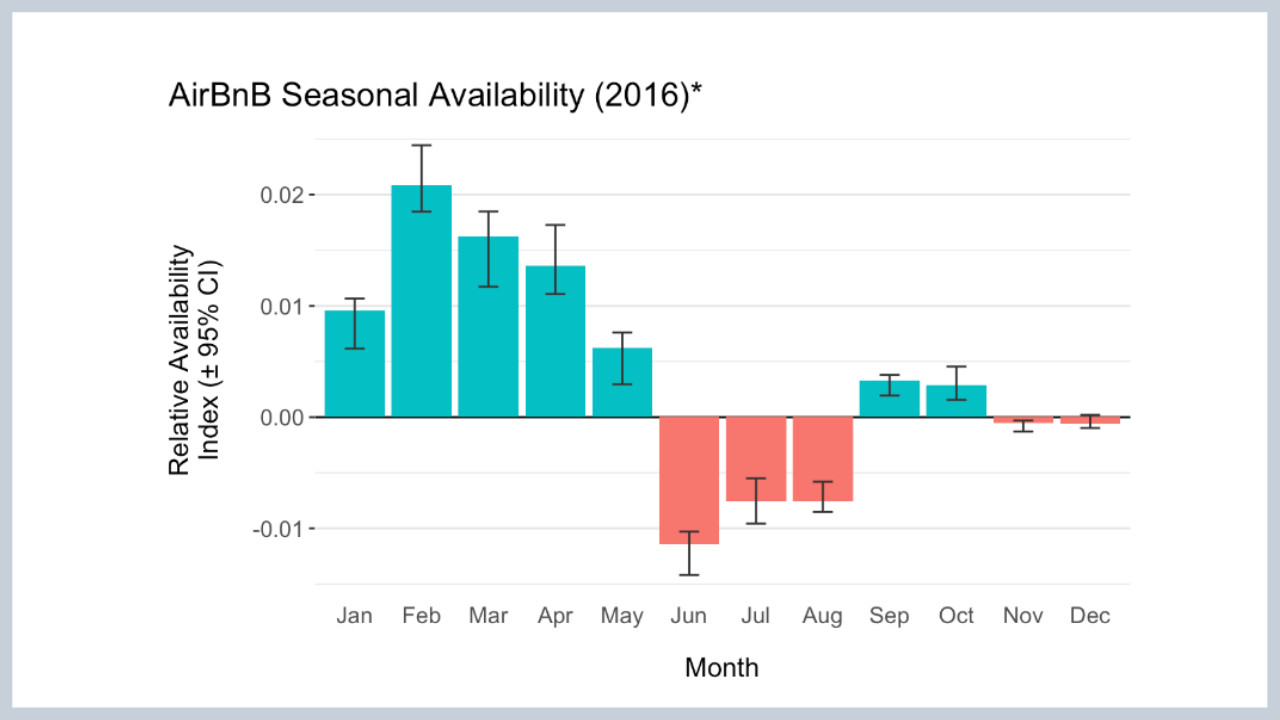
Here I explored available Airbnb data to try to understand differences in booking availability throughout the year. This was a fun project requiring a lot of data work to extract signal from the noise. Click here to view the project.
RestoR: an app for managing biodiversity restoration
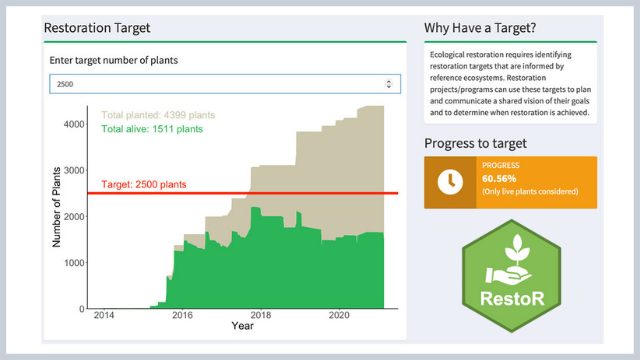
Here’s a tool I built with Anna Calle (Charles Darwin Foundation) to make ecological restoration through adaptive management more efficient and cost-effective. Users will encounter features to facilitate every step of the restoration process, from planting and monitoring, to evaluating the progress toward restoration targets.
Optimizing the cost-effectiveness of plant restoration
I developed a Bayesian framework for evaluating the cost-effectivness and future total costs of different types of plant restoration methods in the Galapagos Islands, Ecuador. These results were immediately welcomed by the Charles Darwin Foundation and Galapagos National Park Directorate for optimizing future ecosystem restoration projects in the islands.
Finding Prime Numbers: a case study in algorithm optimization

Here I code some simple scripts for finding prime numbers using Python, and explore ways to optimize these scripts to run much faster. Amazing the difference that the actual algorithm can make in run time for the same task!
Written multiple blog posts, tutorials, videos, and online courses about learning R
I started the ‘R for Ecology’ online school in 2020 where I’ve since worked with hundreds of students on how to use R for science research. In that process I also started a blog, YouTube channel, and Twitter profile where I share free tutorials and resources.
Are personality archetypes real?
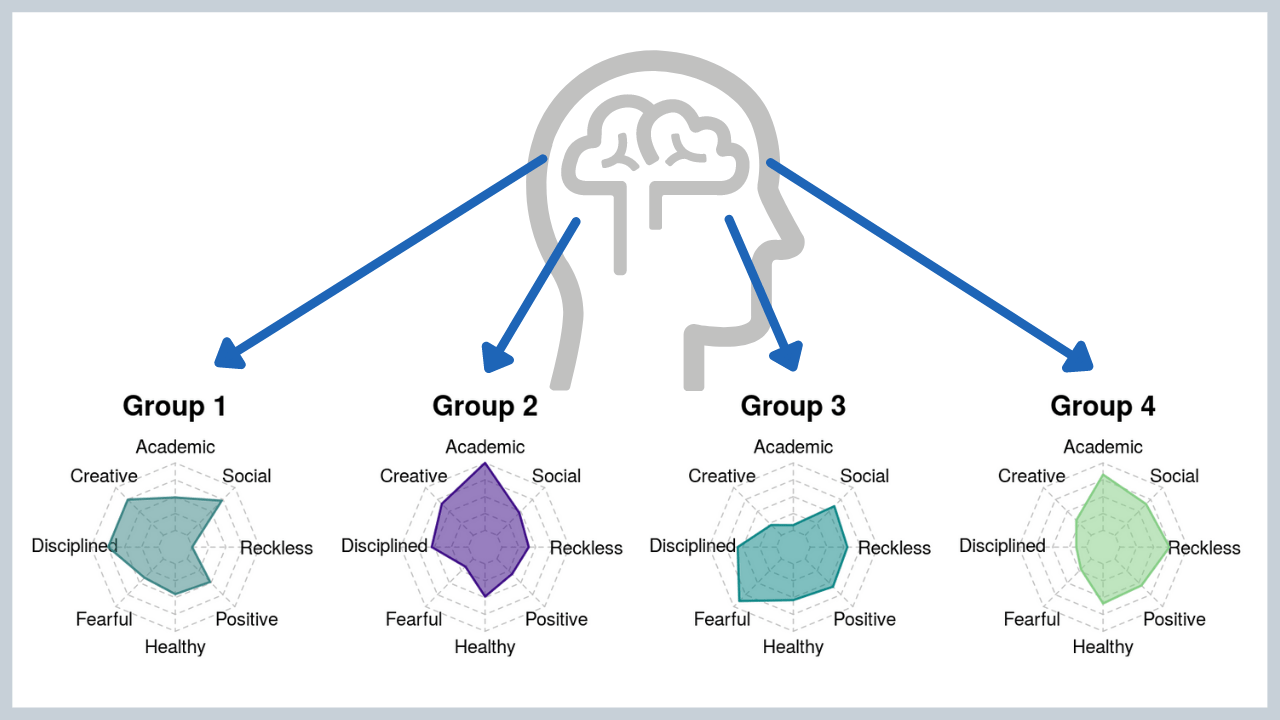
In 2013, students of a statistics class at FSEV UK, Slovakia were asked to invite their friends to participate in a survey consisting of questions related to everything from fears, to hobbies, spending habits, and personality traits. I built a proof-of-concept Shiny App where you can see for yourself how a simple k-means cluster analysis can yield some interesting results with applications towards market segmentation.
Combining data and stories: an infographic about ecosystem restoration in the Galapagos
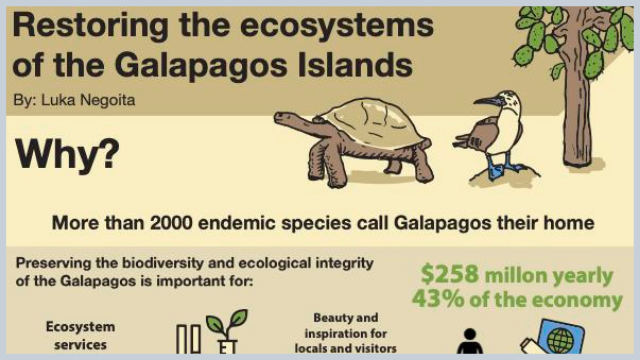
While working at the Charles Darwin Foundation, I was commissioned to create an infographic describing our work on ecosystem restoration in the Galapagos Islands. Here I combined simple data visualizations with custom graphics and text to tell our story.
Visualizing my Amazon book purchase history
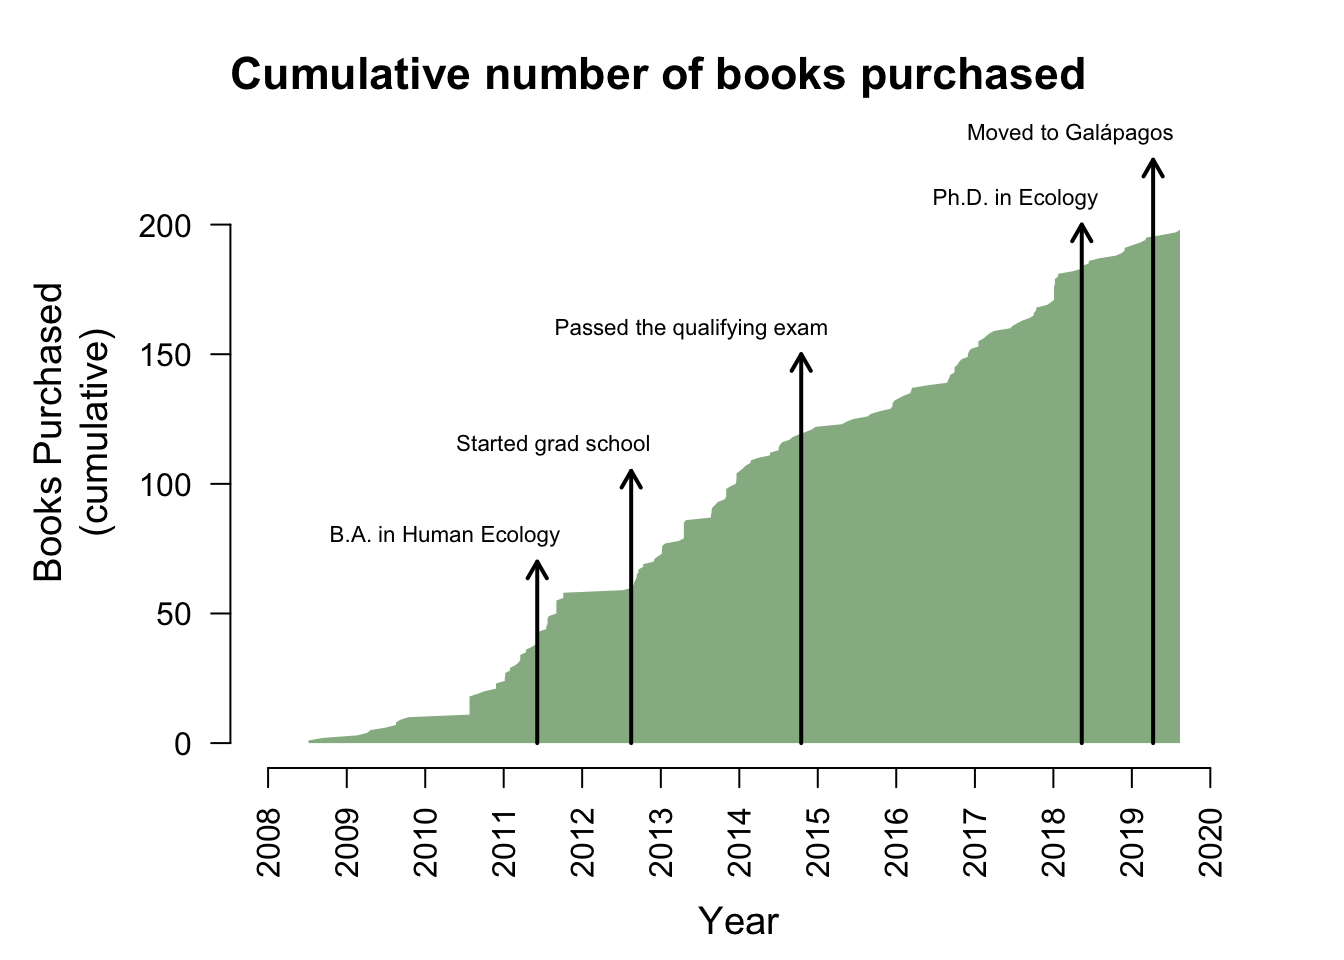
I love books, and I know I’ve purchased way too many books from Amazon, so I figured that might be a good source of data to visualize :)
Can plant movement drive ecosystem function?
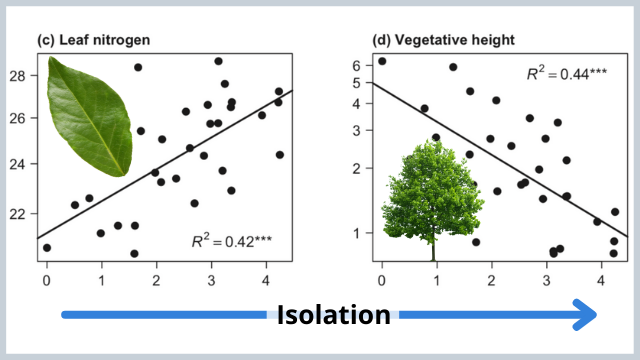
Here I used Bayesian regression, ordination, and model selection to see if island isolation can affect what types of plants make it to isolated Maine coast islands. This was the first empirical study to show that plant movement (or the lack there of) can influence patterns of plant traits on islands.
How to compare two ecosystems
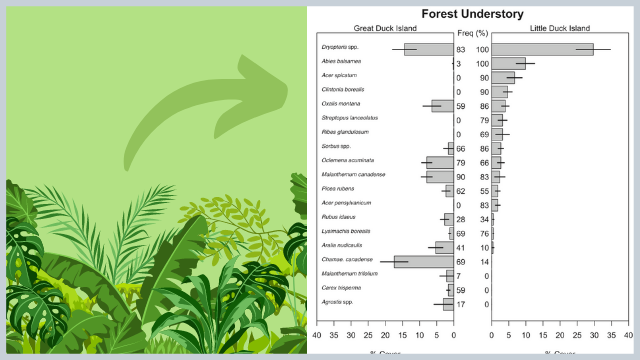
By comparing the biodiversity and composition of two ecosystems we can better understand the factors that differentiate these ecosystems in the first place. In this publication, I compared the plants and soils of two islands in the Gulf of Maine using simple visualizations, tables, and multivariate ordination.
Can you use genetic algorithms to beat the stock market?
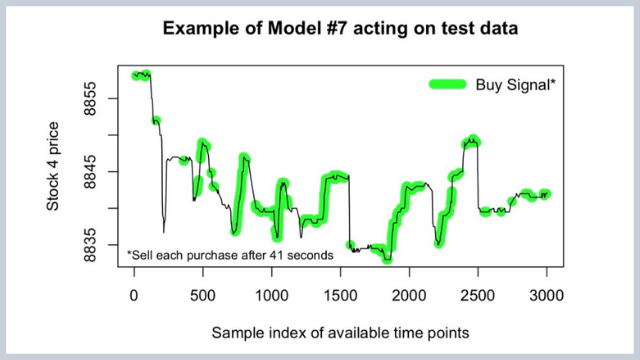
I used a combination of cross-correlation, linear and logistic regression, and Bayesian approaches, along with a genetic algorithm for attempting to optimize a successful stock prediction algorithm.